Deep Dive Series
Margin Health Monitor Explained
Every input. Every output. What the numbers mean and why they matter. Six short lessons that make your Money Date second nature.
Watch First
Margin Health Monitor Tour
Lesson 1
Understanding DSCR
Debt Service Coverage Ratio — your income-to-cost guardrail.
What DSCR Measures
DSCR tells you one thing: how many times over your portfolio's annual income covers your annual margin interest cost. It is the single clearest indicator of whether your EARN system is producing more than it costs to run.
The formula is simple:
DSCR = Annual Portfolio Income ÷ Annual Margin Interest Cost
If your portfolio generates $7,000 per year in dividends and your margin costs $2,800 per year in interest, your DSCR is 2.5. That means your income covers your cost two and a half times over. The system is healthy.
Why 1.25x Is the Default Minimum
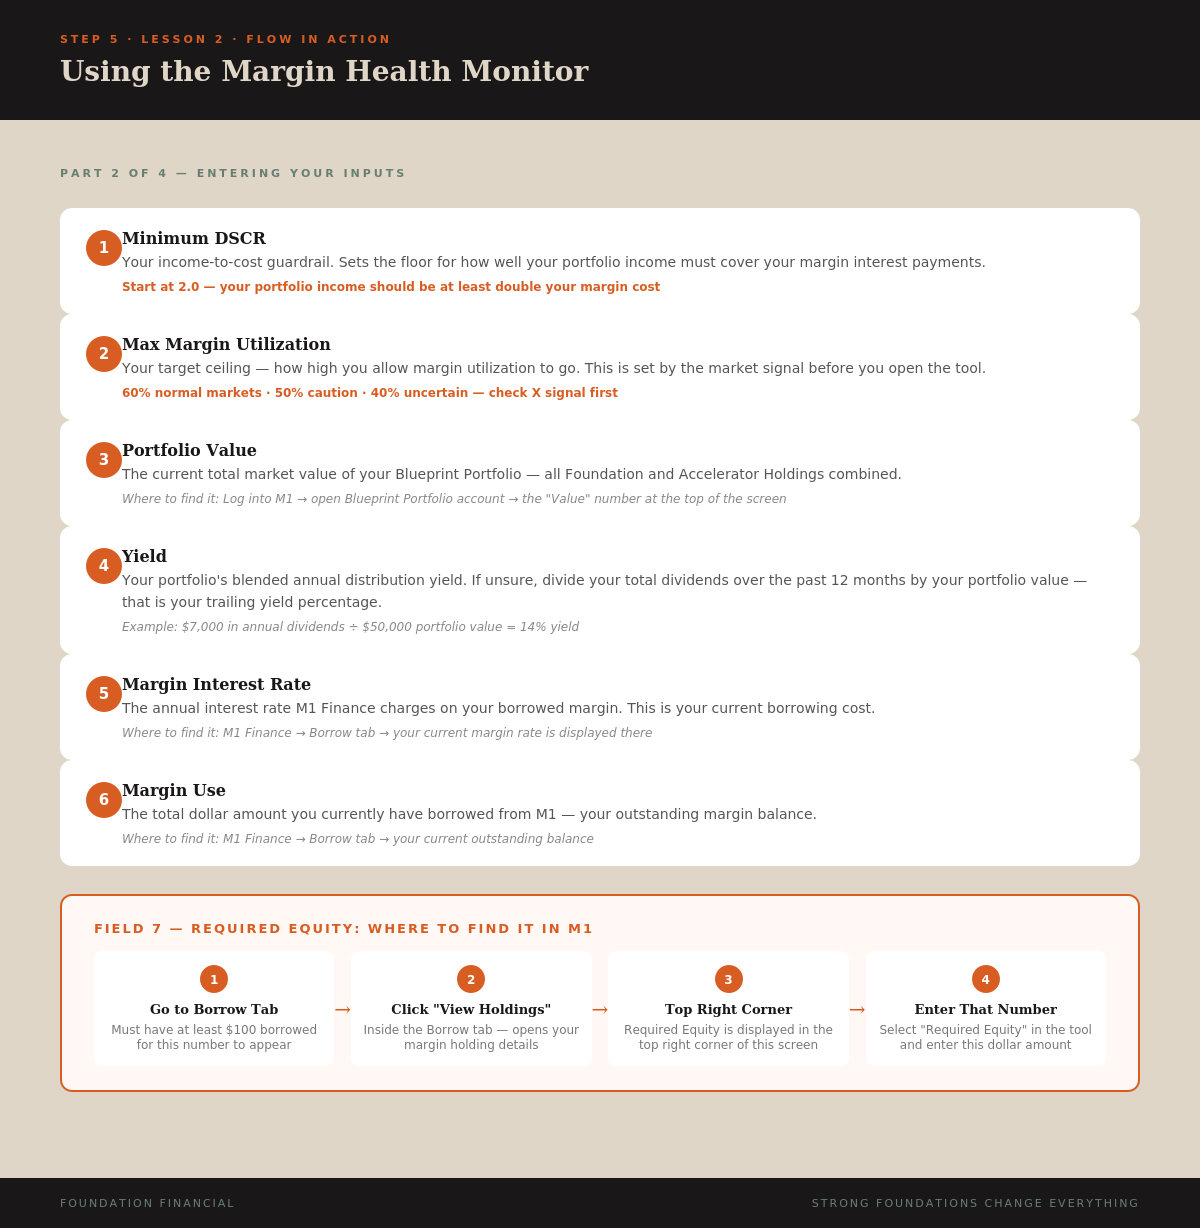
The Margin Health Monitor defaults to a minimum DSCR of 1.25. This means you want your portfolio income to be at least 25% higher than your margin cost at all times.
Why 1.25 and not 1.0? Because 1.0 means you are breaking exactly even — income equals cost, no margin of safety. Markets move. Yields fluctuate. Interest rates shift. At 1.0 any small change could push you negative. The 1.25 buffer ensures you have room to absorb those changes without your EARN system costing more than it produces.
When to Adjust the Default
Most students should keep the minimum DSCR at 1.25 and not touch it. However:
- Conservative approach (2.0): If you want extra cushion or are new to the system, set it to 2.0. This means income must be double your cost before the tool considers you healthy. This is what we recommend during your first few Money Dates.
- Experienced approach (1.25): Once you understand your portfolio's income patterns and feel confident in your yield stability, the 1.25 default gives you more deployment capacity while maintaining a safety buffer.
Never set it below 1.0. A DSCR below 1.0 means your margin is costing more than your portfolio earns — your EARN system is running at a loss.
How to Read DSCR on Your Money Date
What Moves DSCR
Two things drive DSCR: your portfolio income (yield × portfolio value) and your margin cost (interest rate × margin balance). DSCR improves when income goes up or cost goes down. It deteriorates when yields drop, rates rise, or you borrow more without a proportional income increase.
On your Money Date, if DSCR has dropped since last month, ask why. Did yields change? Did you borrow more? Did rates move? Understanding the driver tells you what to do about it.
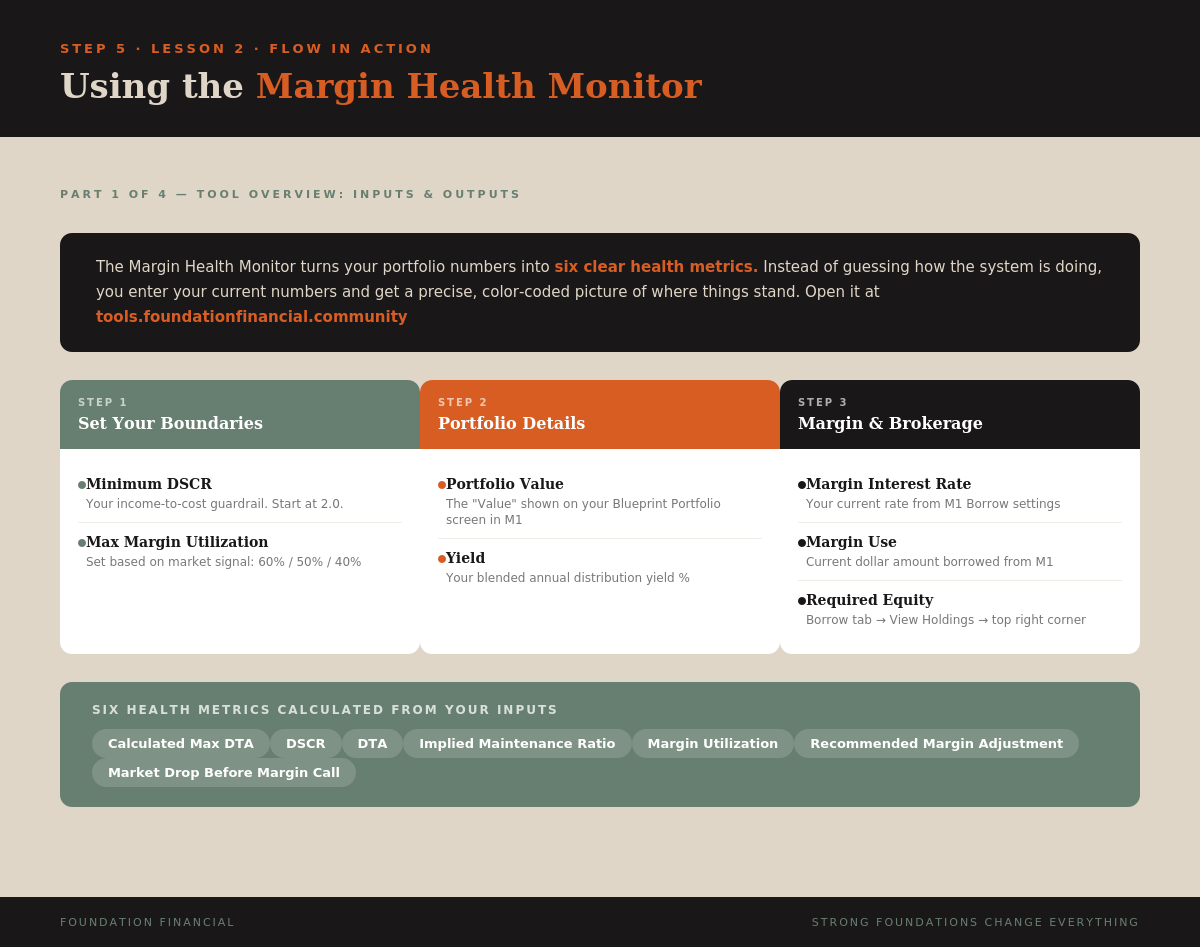
Infographic — Tool Overview
Key Takeaway
DSCR = income ÷ cost. Default minimum is 1.25x. Start at 2.0 while learning. Green means your EARN system is producing well above its cost. Red means take action immediately. This is the first metric that tells you if the machine is profitable.
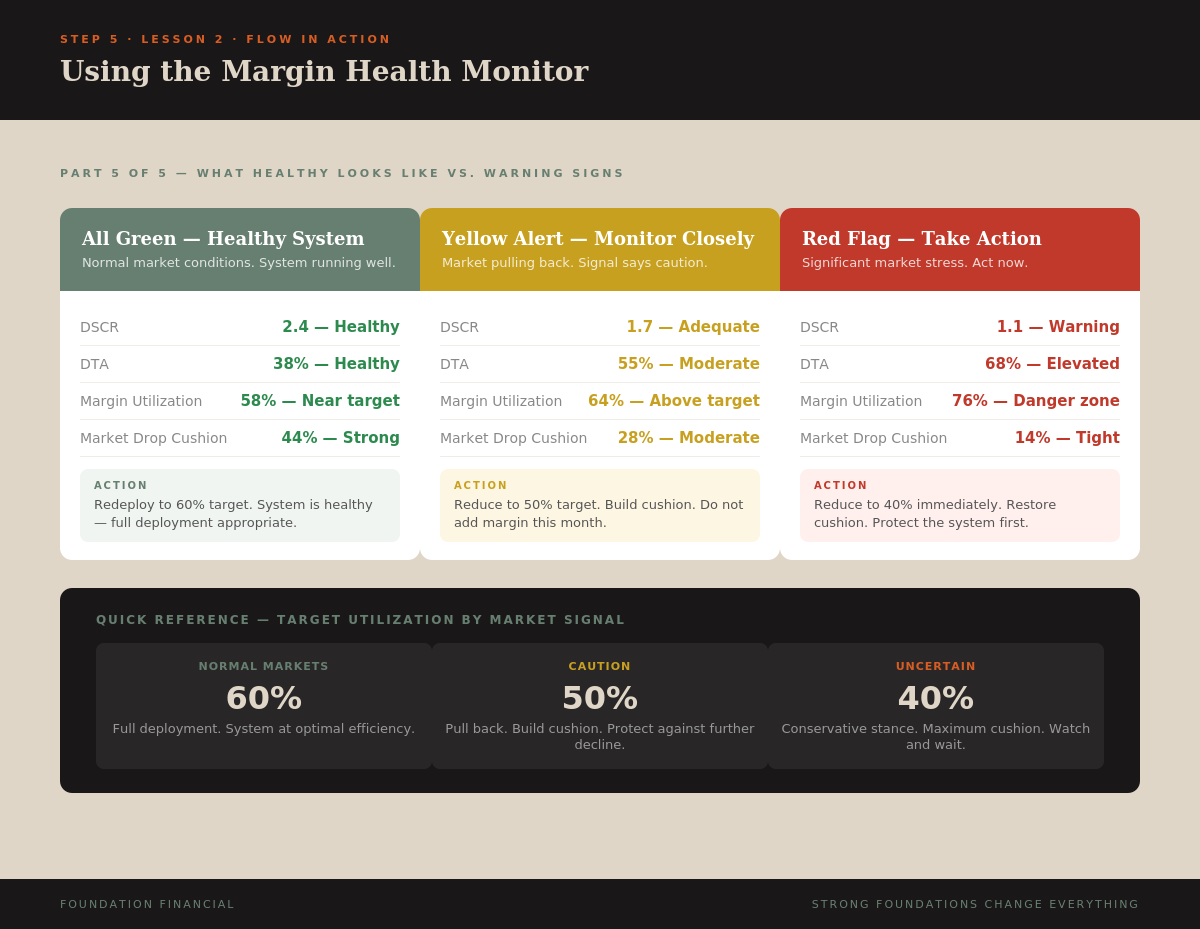
Lesson 2
Max Margin Utilization
The dial you adjust every Money Date based on market conditions.
What Max Margin Utilization Means
Max Margin Utilization is the ceiling you set for how much of your available margin you are willing to deploy. If you have $10,000 in available margin and set your max utilization to 60%, you will deploy up to $6,000. The remaining $4,000 stays as a safety buffer between you and a margin call.
This is the one input in the Margin Health Monitor that changes every month. Everything else — portfolio value, yield, interest rate — you observe and report. Max Utilization is the one you actively decide.
The Red Light / Green Light System
Think of market conditions like a traffic signal. The Blueprint market signal on X (@marketsign39815) posts one of three conditions before each Money Date:
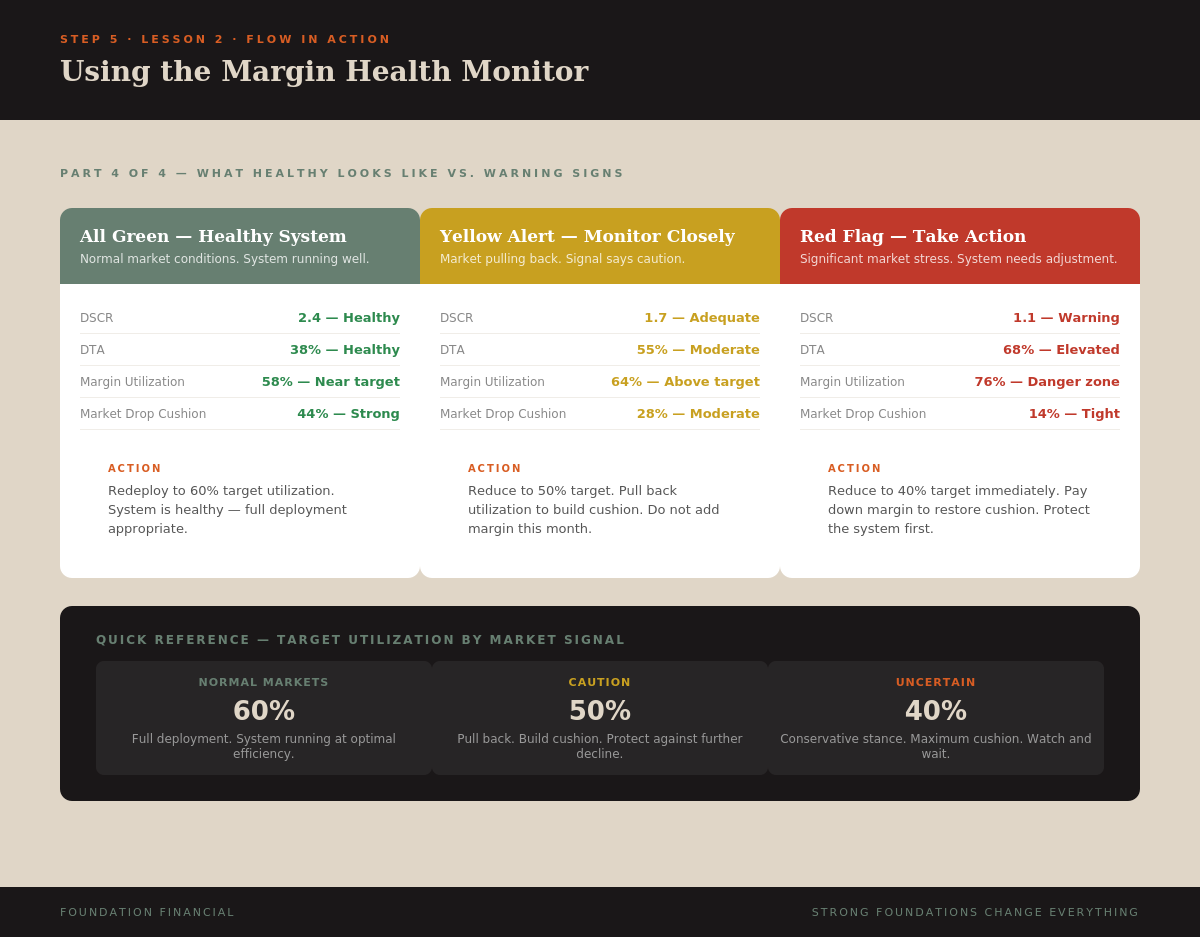
Green light. Markets are running well, volatility is manageable. Deploy your EARN system at full capacity. This is where the most compounding happens.
Yellow light. Elevated volatility, meaningful pullback. Pull back ten points. Widen your buffer. Protect the cushion while the EARN system still runs.
Red light. Sharp declines or systemic stress. Dial all the way back. Maximum buffer. The EARN system shifts to preservation mode — still active, but conservative.
Why the Range Is 40-60%
The range is intentionally narrow. You never go above 60% even in perfect conditions — that upper limit keeps you well below the danger zone. You never go below 40% even in severe stress — the system still needs enough margin deployed to generate income and keep the EARN cycle turning.
Ten percentage points per step. Simple. No guesswork. The signal tells you where to set the dial. You set it, run the calculator, and execute.
Where to Enter It
In the Margin Health Monitor, Max Margin Utilization is in Step 1 — Set Your Boundaries. Enter 60, 50, or 40 based on the current signal. This number drives the Recommended Margin Adjustment output — the tool tells you exactly how many dollars to deploy or pull back to reach your target.
Infographic — Healthy vs. Warning vs. Red Flag
Key Takeaway
Check @marketsign39815 before every Money Date. Normal = 60%, Caution = 50%, Uncertain = 40%. This is the one input you actively decide each month. The 40-60% range keeps you deployed enough to grow and protected enough to hold through volatility.
Lesson 3
Portfolio Value Deep Dive
The total market value of your Blueprint Portfolio — and what drives it.
Where to Find It in M1
Log into M1 Finance. Open your Blueprint Portfolio account. The number labeled "Value" at the top of the screen is your portfolio value. This is the number you enter in the Margin Health Monitor.
This is the value inside your Blueprint Portfolio pie — not your total M1 account balance across all accounts. Just the pie.
What Portfolio Value Includes
Your portfolio value includes everything inside your Blueprint pie:
- Your contributed capital — every dollar you have deposited and invested through your Monthly Commitment
- Margin capital — borrowed funds that have been invested into the pie through Rule 2
- Reinvested dividends — every dividend that swept to Sweep and got invested back through Rule 2
- Market appreciation (or depreciation) — unrealized gains or losses on your holdings
This is important: portfolio value reflects both your money and borrowed money working together. That is the EARN system — your capital and margin capital combined, generating income on the full balance.
How Portfolio Value Grows Over Time
Portfolio value grows through three engines:
- Monthly Contributions — your recurring deposit through Income Hub → Sweep → Blueprint pie. Every contribution adds to the base.
- Dividend reinvestment — every dividend that sweeps back through Rule 2 and gets invested. This is compounding in action.
- Margin deployment — each time you redeploy margin on your Money Date, you are putting more capital to work in the pie. More capital deployed = more income generated = faster compounding.
On rough months portfolio value may decline due to market prices dropping. This is normal. Your Foundation Holdings (65% of the pie) are designed for stability. The contributions and dividends flowing in during a dip buy more shares at lower prices — Building the Base when it costs less.
Why Accuracy Matters
Portfolio value is the foundation of almost every calculation in the Margin Health Monitor. DTA (Debt to Asset), margin utilization, recommended adjustment — they all depend on an accurate portfolio value. Always use the current number from M1, not last month's number or a rough estimate.
Key Takeaway
Portfolio Value = the "Value" number inside your Blueprint Portfolio pie in M1. It includes your money, margin money, reinvested dividends, and market movement. Always use the current live number on your Money Date — every other calculation depends on it.
Lesson 4
Yield Calculation
Your portfolio's income engine — how much it pays and how to measure it.
What Yield Means in the Blueprint
Yield is the annual percentage rate at which your Blueprint Portfolio generates income through dividends and distributions. A 12% yield on a $50,000 portfolio means the portfolio generates approximately $6,000 per year — or about $500 per month — in passive income.
This income is what powers your EARN system. It covers your margin cost (tracked by DSCR), it flows through Sweep via Rule 2 to pay down margin, and it compounds by reinvesting back into the pie. Yield is the heartbeat of the whole machine.
How to Find Your Yield in M1
In M1 Finance, navigate to your Blueprint Portfolio. Go to Performance → View Benchmarks. Your trailing dividend yield is displayed there.
If you cannot find it through benchmarks, you can calculate it manually:
Yield = (Total Dividends Last 12 Months ÷ Current Portfolio Value) × 100
Example: If your portfolio paid $7,000 in dividends over the past year and your current portfolio value is $50,000, your yield is 14%.
Enter this number as a whole number in the Margin Health Monitor (enter 14, not 0.14).
Why Yield Changes
Yield is not fixed. It moves for several reasons:
- Portfolio value changes — if your portfolio value rises but dividends stay the same, yield goes down. If value drops, yield goes up. This is math, not a problem.
- Holdings change distributions — some ETFs adjust distributions based on market conditions. Covered call ETFs (Accelerator Holdings) may pay more during high volatility and less during calm periods.
- You change holdings — if you swap an ETF for one with a different distribution rate, your blended yield shifts.
On your Money Date, if yield has changed meaningfully from last month, recalculate before entering it. The DSCR calculation depends on an accurate yield.
Foundation vs. Accelerator Yield
Your Foundation Holdings (65%) typically generate steady, credit-driven income — senior loans, CLOs. Their yield tends to be consistent month to month.
Your Accelerator Holdings (35%) often generate higher but more variable income — covered call strategies, equity-linked premiums. Their yield can fluctuate with market volatility.
The blended yield across both is what you enter in the tool. Over time, as Foundation Holdings compound, the overall yield stabilizes because the majority of your portfolio is in the steady bucket.
Key Takeaway
Yield = annual income ÷ portfolio value. Find it in M1 under Performance → View Benchmarks, or calculate manually. This is your EARN system's income rate — it drives DSCR, powers dividend reinvestment, and determines how fast the machine compounds. Recalculate on any Money Date where it has shifted.
Lesson 5
Required Equity & Interest Rate
The two brokerage inputs that define your margin boundaries.
What Required Equity Is
Required Equity is the minimum dollar amount of equity M1 Finance requires you to maintain in your account to avoid a margin call. Think of it as the floor — if your equity drops below this number, M1 can force-sell your holdings to bring you back into compliance.
The Margin Health Monitor uses Required Equity to calculate your safety cushion — specifically the Market Drop Before Margin Call metric. This tells you how far your portfolio can fall before that floor gets hit.
Where to Find Required Equity in M1
This is a specific navigation path — follow it exactly:
- Log into M1 Finance
- Go to the Borrow tab
- You must have at least $100 borrowed for Required Equity to appear
- Click "View Holdings"
- Look at the top right corner of that screen
- The dollar amount shown is your Required Equity
Enter this exact dollar amount in the Margin Health Monitor. In the tool, select the "Required Equity" radio button (not "Total Margin Available") before entering the number.
Why Required Equity Varies
Different ETFs carry different maintenance requirements. Some holdings require M1 to hold more equity against them than others. Your Required Equity is the aggregate of all your individual holding requirements.
If you change your holdings — swap one ETF for another — Required Equity will shift. This is why you check it fresh on each Money Date rather than using last month's number.
What Margin Interest Rate Is
The Margin Interest Rate is the annual percentage rate M1 charges you on your outstanding margin balance. This is the cost side of your DSCR equation — the number your portfolio income must exceed to run the EARN system profitably.
Where to Find Interest Rate in M1
- Go to the Borrow tab in M1 Finance
- Your current margin rate is displayed on that screen
- Enter it as a percentage in the Margin Health Monitor (e.g., enter 8.5 for 8.5%)
How Interest Rate Affects Your System
Margin interest rate directly impacts two things:
- DSCR — higher rate means higher annual cost, which pushes DSCR down. If rates rise, your portfolio income needs to cover a larger cost.
- EARN system efficiency — the gap between your portfolio yield and your margin rate is your spread. A 14% yield against an 8.5% rate gives you a 5.5% positive spread. That spread is what makes the EARN system work — you earn more on the borrowed capital than it costs to borrow.
If rates rise to the point where your margin rate approaches or exceeds your yield, DSCR will drop toward or below 1.0. The Margin Health Monitor will flag this immediately. That is why you check DSCR on every Money Date.
Infographic — All Seven Inputs
Key Takeaway
Required Equity: Borrow tab → View Holdings → top right corner. Need $100+ borrowed to see it. Interest Rate: Borrow tab, displayed directly. These two numbers define your margin boundaries — Required Equity sets the safety floor, Interest Rate sets the cost of running the EARN system. Check both fresh on every Money Date.
Lesson 6
Understanding Your Results
Six metrics. One priority order. Here is how to read your Money Date dashboard.
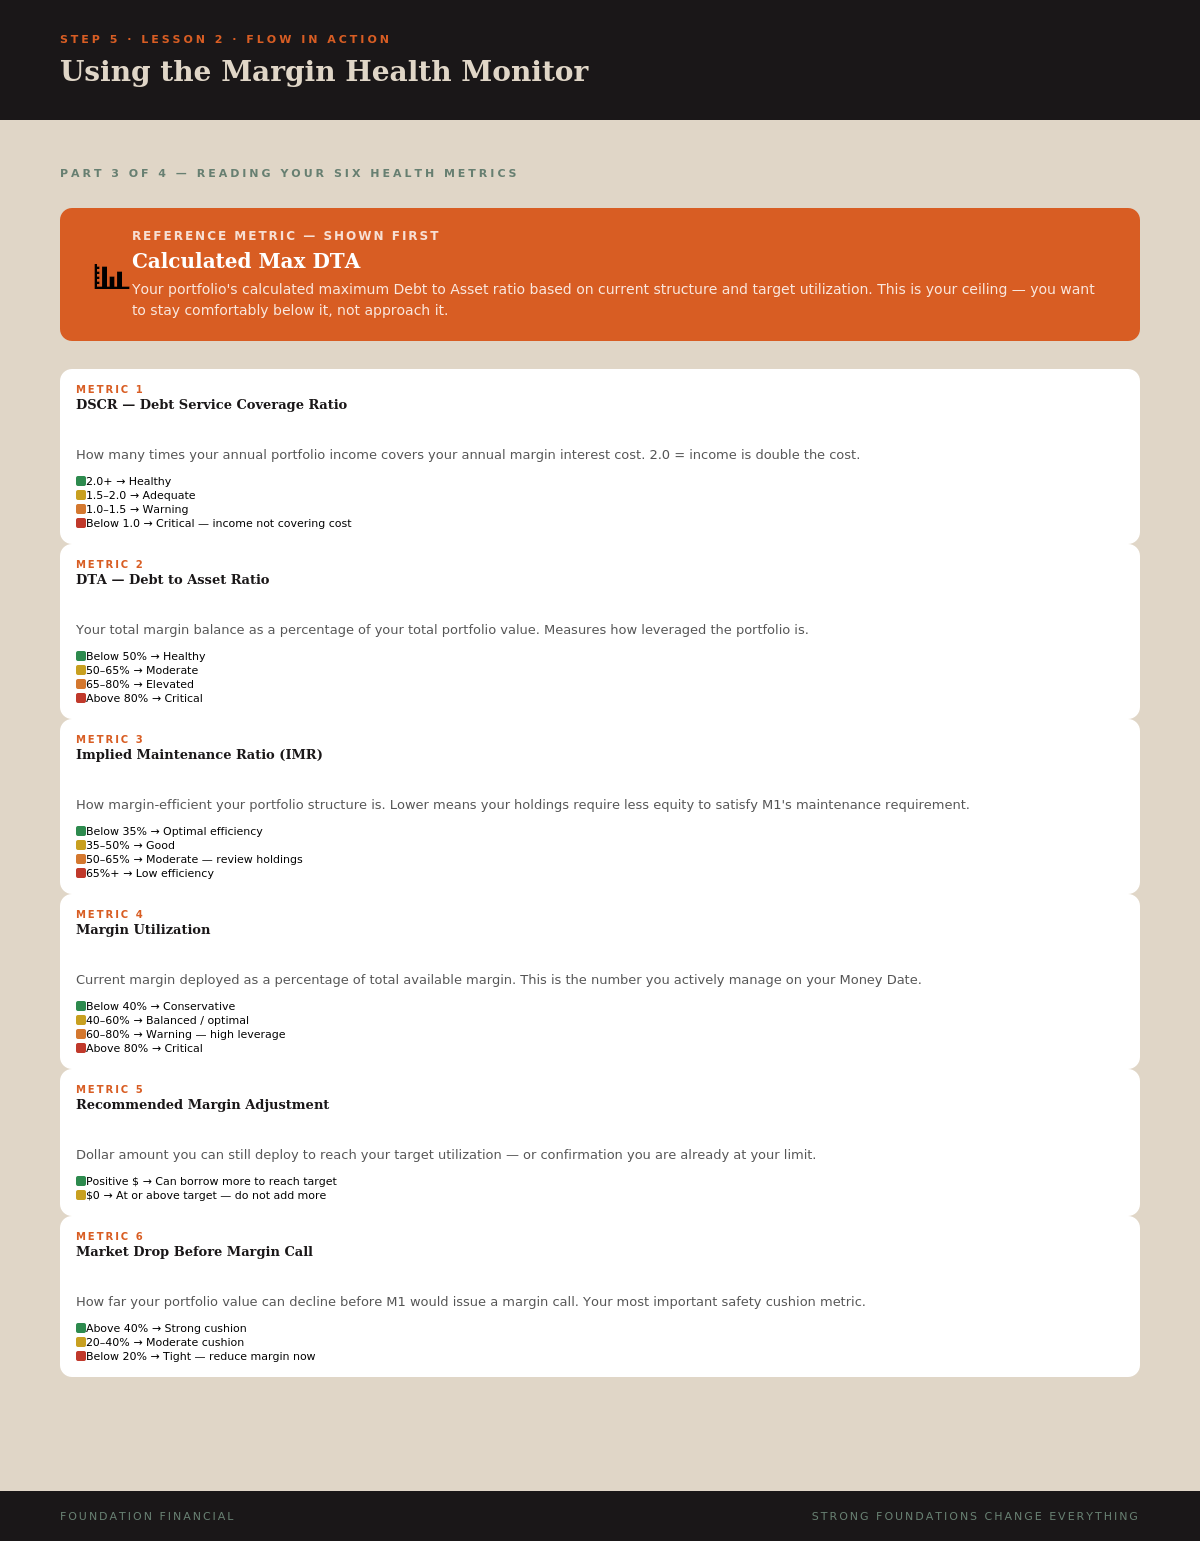
After you enter all your inputs and hit Calculate Results in the Margin Health Monitor, six health metrics appear. Each one tells you something different about your system. Here is what they mean and the order in which to check them.
Priority 1 — Market Drop Before Margin Call
Check this first. Every time.
This metric tells you how far your total portfolio value can decline — in percentage terms — before M1 would issue a margin call. It is your safety cushion.
If this metric is below 20%, nothing else matters. Reduce first. Then review the rest.
Priority 2 — DSCR (Debt Service Coverage Ratio)
Is your income covering your margin cost? You learned this in Lesson 1.
Priority 3 — DTA (Debt to Asset Ratio)
Your total margin balance as a percentage of your total portfolio value. This measures overall leverage.
Priority 4 — IMR (Implied Maintenance Ratio)
How margin-efficient your portfolio structure is. This reflects the aggregate maintenance requirement of your holdings relative to portfolio value. Lower is better — it means your ETFs are capital-efficient.
Green below 35%. If orange or red, some of your holdings may carry unusually high maintenance requirements, which reduces your available margin and tightens your cushion. Worth reviewing your ETF selection if this stays elevated.
Priority 5 — Margin Utilization
Your current margin deployed as a percentage of your total available margin. This is the number you are actively managing to match your signal target.
If the signal says 60% and your utilization is at 45%, you have room to deploy. If it says 50% and you are at 58%, you need to pay down. The Recommended Margin Adjustment tells you the exact dollar amount.
Priority 6 — Recommended Margin Adjustment
This is your execution number. The tool calculates exactly how many dollars you can deploy (or need to pay back) to reach your target utilization.
- Positive number — you can draw this amount from M1 Borrow. Rule 2 will automatically route it to margin paydown first, then invest the remainder.
- Zero — you are at your target. No action needed. Close the tool.
- Negative number — you are over-deployed. Pay down this amount through the Borrow tab in M1 to reach your target.
The Complete Check Sequence
On every Money Date, read your results in this exact order:
- Market Drop cushion — am I safe? (Below 20% = reduce now)
- DSCR — is income covering cost? (Below 1.0 = reduce now)
- DTA — how leveraged am I? (Sanity check)
- IMR — are my holdings efficient? (Background check)
- Margin Utilization — where am I vs. target?
- Recommended Adjustment — what do I execute?
Steps 1-2 are safety checks. If either is red, you stop and reduce before anything else. Steps 3-4 are awareness checks. Steps 5-6 are your action. One decision. Execute. Done.
Infographics — Metrics Reference & Scenarios
Key Takeaway
Six metrics, one priority order. Safety first (Market Drop cushion, DSCR), then awareness (DTA, IMR), then action (Utilization, Recommended Adjustment). If any safety metric is red, reduce immediately — that is the override rule. Everything else follows the signal and the recommendation.
You Know the Tool
Every input. Every output. Every priority. You can now sit down for your Money Date, open the Margin Health Monitor, and read your system's health with confidence.
Next step: Run a live Money Date using the Margin Health Monitor with your actual numbers.